Using Heatmaps in the Visitor Recordings App
Last updated on August 27, 2026
See where visitors click, how far down they scroll, and where they lose interest, built from the recordings you are already collecting.
Is this for me?
Heatmaps turn your existing session recordings into a single picture of one page. Where a recording shows you what one visitor did, a heatmap shows you what everyone did, painted over a real capture of the page.
They are worth your time if you want to answer questions like:
- Are shoppers reaching my add to cart button, or giving up above it?
- Which parts of my product page are shoppers clicking, and which are they ignoring?
- Where are visitors getting frustrated and clicking something that does nothing?
- Which elements do the shoppers who go on to buy tend to click?
You do not need to set anything up to collect the data. Heatmaps read the recordings the Visitor Recordings app already captures.
⚡Before you start: a page needs at least 25 recorded sessions before a heatmap will draw. If you create one on a quieter page, you will see how many sessions it still needs, and the map fills in as more visitors browse. Recordings are kept for 31 days, and a heatmap can be built from a window of up to 30 days.
Finding heatmaps
Open the Visitor Recordings app and choose the Heatmaps tab, next to Recordings, Live now and Settings.
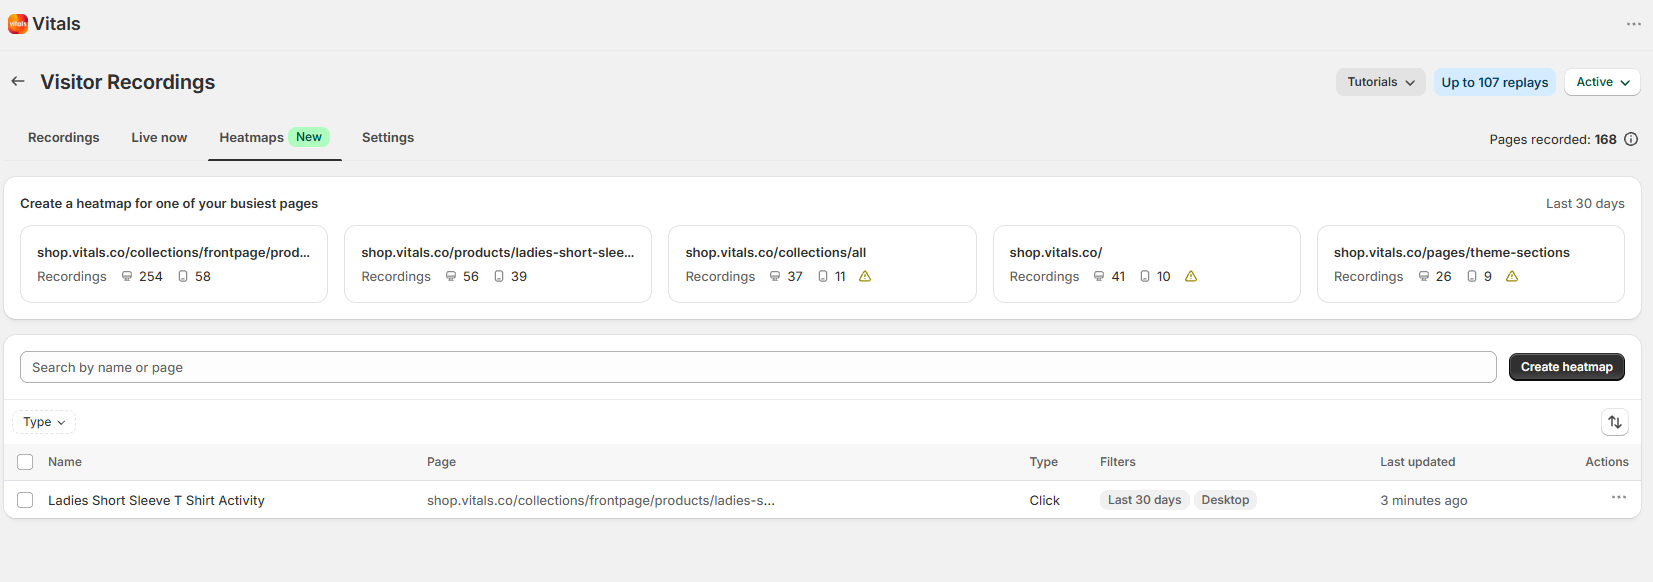
The page has two parts:
- Create a heatmap for one of your busiest pages shows your five most-viewed pages from the last 30 days, marked Last 30 days on the same line. Each card carries a Desktop and a Mobile recordings count side by side, and clicking anywhere on the card opens the create form with that page filled in. A warning icon appears on a page that does not have enough recordings yet, and names the device it applies to — the 25-session minimum is counted per device, so a page can be ready for a desktop heatmap and not a mobile one.
- Below that is your list of saved heatmaps, with a search box and a Create heatmap button above it. You can search by name or page, filter by type, and sort by name or by when it was last updated.
Creating a heatmap
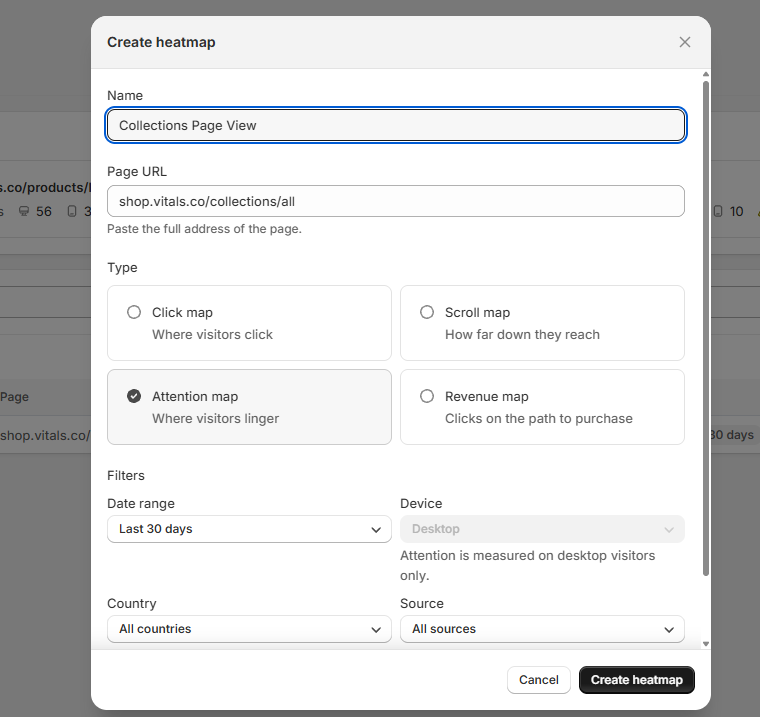
- Start the create form, either by clicking one of the busiest-page cards or with the Create heatmap button above your saved list.
- Give it a Name. Every heatmap needs one, and each name has to be different from your others, so use something you will recognise later such as "Best seller PDP, click".
- Set the Page URL. Paste the full address of the page, for example
yourstore.com/products/best-seller. A path on its own is not enough — you will be asked to include the full address. - Pick a Type. There are four, covered below.
- Set the Filters. There are four: Date range (up to the last 30 days), Device, Country and Source. Device is not optional and there is no all-devices setting — it stays on Desktop unless you switch it to Mobile. A heatmap is drawn over a single capture of the page, and that capture is either desktop or mobile, so check this before you create anything: like the other filters, it is fixed once the heatmap exists. On an attention map the field is locked to Desktop.
- Decide whether the heatmap keeps updating. Keep updating as new sessions arrive is on by default. Turn it off to freeze the heatmap as a snapshot of the sessions collected so far.
Choose Create heatmap.
💡Once a heatmap exists, the only thing you can change is its name. The page, the type, the filters, and the live or frozen setting are all fixed. To look at the same page a different way, create a second heatmap rather than editing the first.
The four heatmap types
| Type | What it shows | Use it to |
|---|---|---|
| Click map | Where visitors click | Find the elements that pull attention, and the ones nobody touches |
| Scroll map | How far down they reach | See how much of your page shoppers see before they stop |
| Attention map | Where visitors linger | Find the sections shoppers read rather than scroll past |
| Revenue map | Clicks on the path to purchase | See which elements the shoppers who buy tend to click |
Attention maps are built from desktop sessions only, and clear two floors rather than one. The page still needs the usual 25 recorded sessions, and on top of that 10 of its desktop sessions have to have produced a usable measurement before the heat is drawn. That second floor is why an attention map can sit empty on a page whose click map draws perfectly well.
Reading a heatmap
Open a saved heatmap and you will see the page as visitors saw it, with the heat drawn over the top.
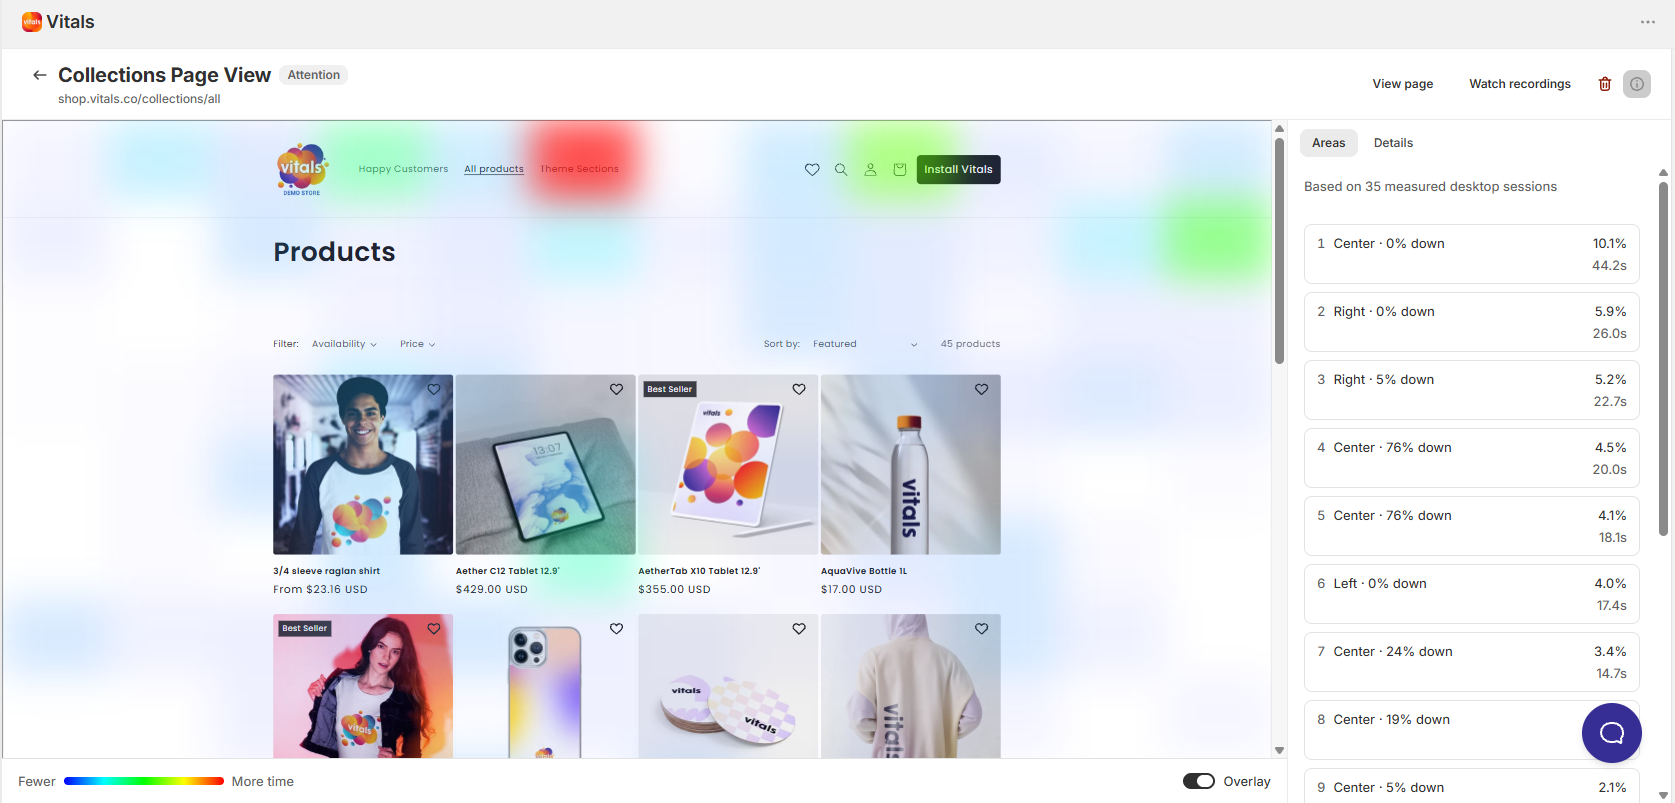
- The Overlay switch above the page turns the heat layer on and off, so you can compare it against the bare page.
- The legend runs from Fewer to More clicks, More reach or More time, depending on the type.
- The panel beside the page has two tabs. The first lists what was measured, named Elements for click and revenue maps, Scroll reach for scroll maps and Areas for attention maps. The second, Details, summarises the heatmap itself.
- View live page opens the real page in a new tab, and Watch recordings takes you to the recordings behind the heatmap.
Clicks, rage clicks and dead clicks
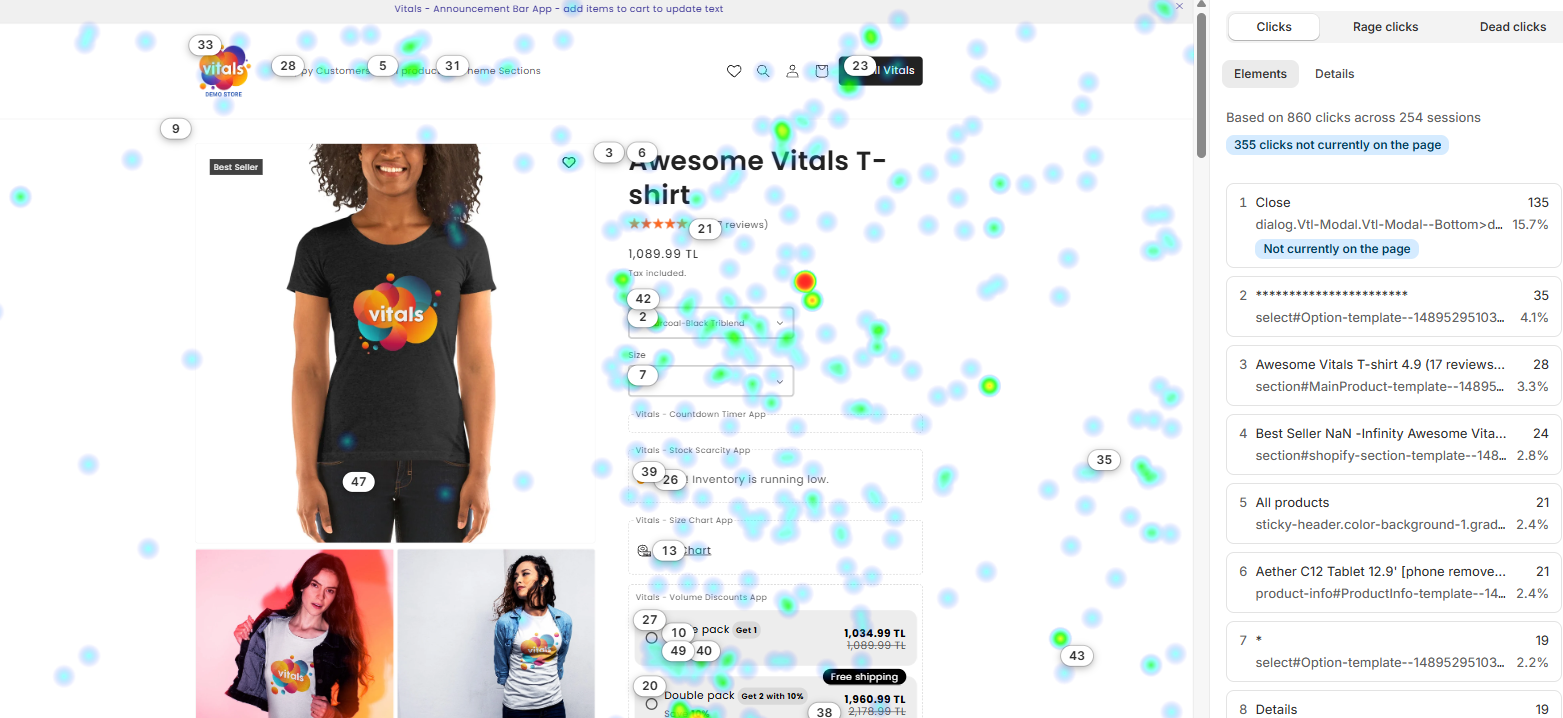
On a click map you can switch the view between Clicks, Rage clicks and Dead clicks.
- Clicks is every click that was recorded.
- Rage clicks are repeated clicks in the same spot in quick succession, which usually means a shopper expected something to happen and it did not.
- Dead clicks are clicks on something that is not clickable, which often points at an image or a piece of text that looks like a button.
Both of the last two are worth checking on any page where shoppers drop off without an obvious reason.
What the Details tab tells you
Details shows the heatmap's Type and Page, when it was Last updated, and whether Updates reads New sessions included or Paused (snapshot). It also repeats the filters you set, along with the number of sessions, page views and clicks behind the map.
Managing your heatmaps
- Rename a heatmap from its row in the saved list.
- Delete one from its row, or select several with their checkboxes and choose Delete selected. Deleting removes the heatmap and its settings for good, though your recordings are untouched.
- You can save up to 25 heatmaps per store. Once you reach that, creating another one is refused until you delete one you no longer need.
Frequently Asked Questions
Do I need to turn heatmaps on before they start collecting data?
No. Heatmaps are built from the session recordings the Visitor Recordings app already captures, so there is nothing to switch on and no code to add. As long as the app is running on your store, the data is there waiting.
My heatmap says it needs more sessions. What now?
A page needs at least 25 recorded sessions before a heatmap will draw a reliable picture, and you will see how many it has so far. Leave it in place if you left Keep updating as new sessions arrive on, and it fills in as traffic comes through. If you froze it as a snapshot, create a new one once the page has more traffic.
Why can I not edit the page or the filters on a heatmap I already made?
A heatmap is measured against the settings you chose when you created it, so changing them halfway would mix two different sets of sessions into one picture. Create a second heatmap with the settings you want instead, and delete the first one if you no longer need it.
Can I compare two versions of the same page?
Yes, and this is the main reason to freeze a heatmap. Before you change a page, create a heatmap and turn Keep updating as new sessions arrive off so it holds the sessions collected up to that point. Make your change, create a second heatmap for the same page, and you have a before and after.
How far back does a heatmap go?
Up to 30 days. You can narrow it further when you create the heatmap by choosing a shorter Date range. Recordings themselves are kept for 31 days, and 30 days is the widest range a heatmap can be built from.
The scroll map shows a page height that looks wrong. Why?
Scroll depth is worked out from how far your visitors got, so the bottom of a scroll map is the furthest anyone reached rather than the true bottom of the page. On a page where almost nobody scrolls to the end, the map will look shorter than the page really is.
Does a revenue map tell me which elements make people buy?
Not on its own. A revenue map shows how often shoppers who clicked a given element went on to add to cart or order. That is a useful signal about what buyers pay attention to, and it is a good place to start looking, but it does not prove the click caused the sale.
One thing to expect: those rates are worked out per element, and an element needs 30 attributed sessions of its own before it shows one. So on a quieter page the map can appear with most elements still blank even though the page itself cleared the 25-session floor. That is the map waiting for data rather than a fault, and the create form warns you about it when you pick the revenue type.
Do heatmaps slow my store down?
No. Heatmaps are drawn in your Vitals dashboard from data that has already been collected. Nothing extra runs on your storefront, and your shoppers see no difference.
❓ Not sure which page to start with? Open the Heatmaps tab and look at Create a heatmap for one of your busiest pages. Those are your most-viewed pages from the last 30 days, so they are the ones with enough traffic to give you a clear picture. Our support team is available 24/7 if you would like a hand reading one.